This map shows an overall wildfire risk index for the NWACA area. The index values are color coded, as shown on the map legend. They are a composite of three components of fire behavior in the wildland urban interface (WUI):
- vegetation hazard, based on density
- slope
- structure density of the area
As you can see from the temperature bar at the bottom of the map, about half of our neighborhood is at extreme or high risk in a wildfire event.
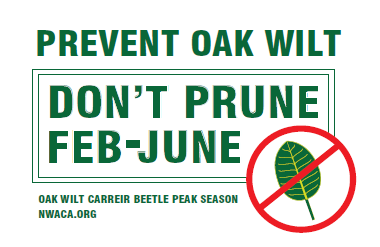
 Until July, sap beetles are attracted to fresh tree wounds and can transmit the oak wilt fungus to a healthy oak tree during pruning. The heat of July-August is believed to suppress the beetles and reduce the risk of infection. Note that all trees are under the normal stress of summer, depending on soil moisture, and some are still in their growing season then. So if you haven’t completed pruning of oaks by now, it’s best to wait until fall.